
Tradingview, being a very popular website with almost 180+ million monthly visitors, traders use in trading now a days. It comes with allot of varieties which usually are not available elsewhere, like, charts, structures, news/updates, indicators and strategies and etc. While tradingview indicators are one of the most important things which makes it outstanding and willing to use.
Though there are almost 100+ inbuilt and 5000+ custom built tradingview indicators but out of those custom built ones. There are few indicators which are wonderful and outstanding, many of you have never even heard about these indicators ever.
We are showing you the 5 indicators out of 5000+ which are very good. And you probably did not know about yet.
List of 5 interesting and unknown tradingview indicators:
1: ADX (Average Directional Index)
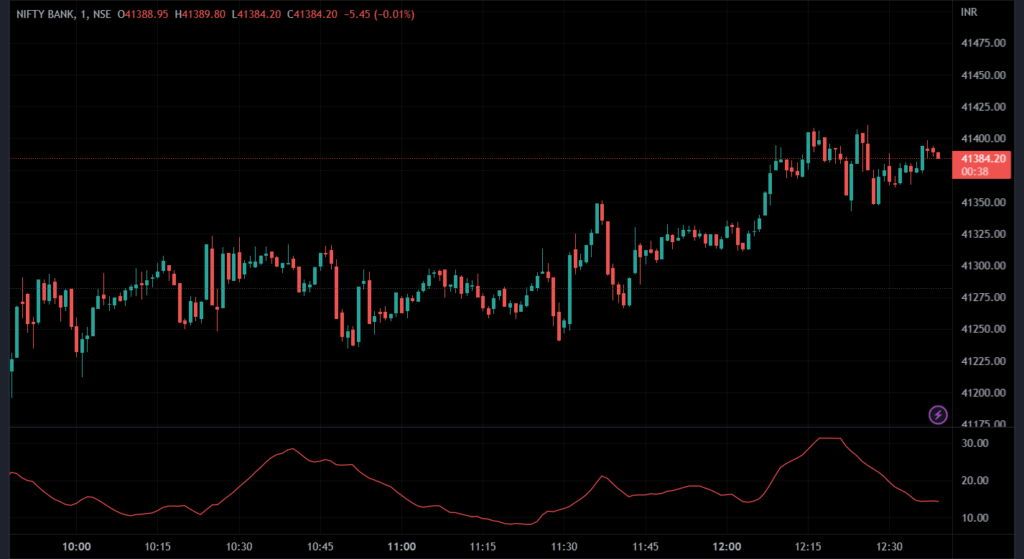
The RED colored line that you can see below candles is how ADX looks
What is the use?
Technical analysts and traders use a specific indicator called the Average Directional Index (ADX) to determine a trend’s strength. The Positive Directional Indicator, also known as +DI, and the Negative Directional Indicator, also known as -DI. These are two indicators that frequently accompany ADX. They demonstrate that the trend can be going up or down.
What does it Indicate?
A trend shows the most strength when the Average Directional Index is above 25 (potential signal to buy). And a trend is weak or the price is considered trendless if the ADX reaches below 20. Keep in mind, if ADX is below 20, it might not be the most ideal time to enter a trade.
Summary
In conclusion, the Average Directional Index is an excellent instrument for technical analysis. And determining the strength of an upward or downward trend. It can be used in conjunction with other indicators to examine trends and determine when the market is in a good state to make a trade.
2: 3 in 1 EMA (Exponential moving average)
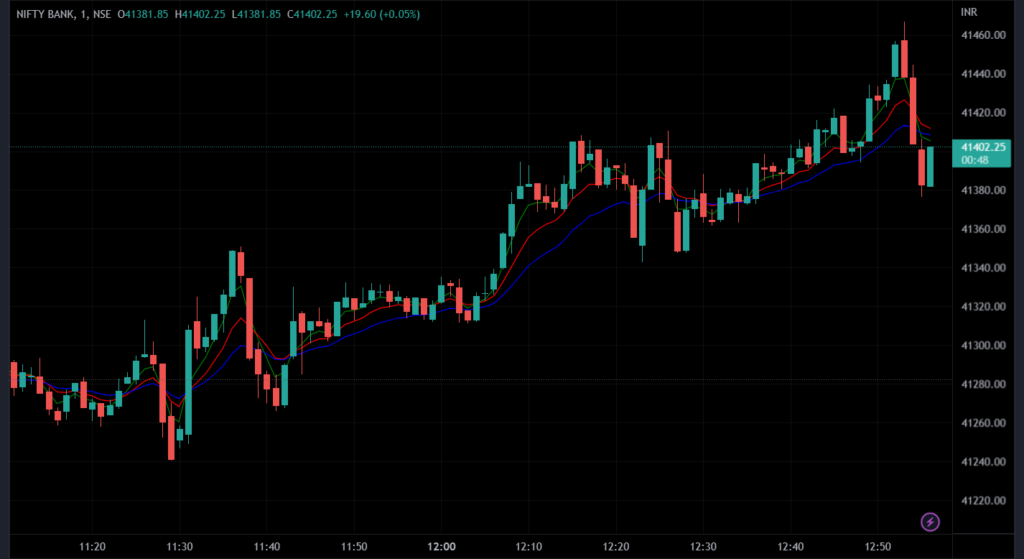
Search “3 in 1 ema” in indicators and you will get 4 to 5 results, select any one of them and it should appear on your chart like above photo. You can change the values and colors of each ema in indicator setting.
What is the use?
As you know that tradingview only allows 3 indicators at a time for free users. If you need to use more than 3 indicators you will need to buy premium version, so using this indicator you can use 3 emas at a single time with single indicator’s value. So you still have space for more two indicators which you can use.
What does it indicate?
The EMA is a technical indicator that, like other moving averages, generates buy and sell signals based on data that indicates crossovers and divergences from general and historical averages. The EMA also tries to emphasize the significance of the most recent data points in calculations.
Summary
You can use these 3 emas altogether instead of one and trade on basis of crossovers or use it as a confirmation for your own trading strategy too.
3: Pivot Point SuperTrend
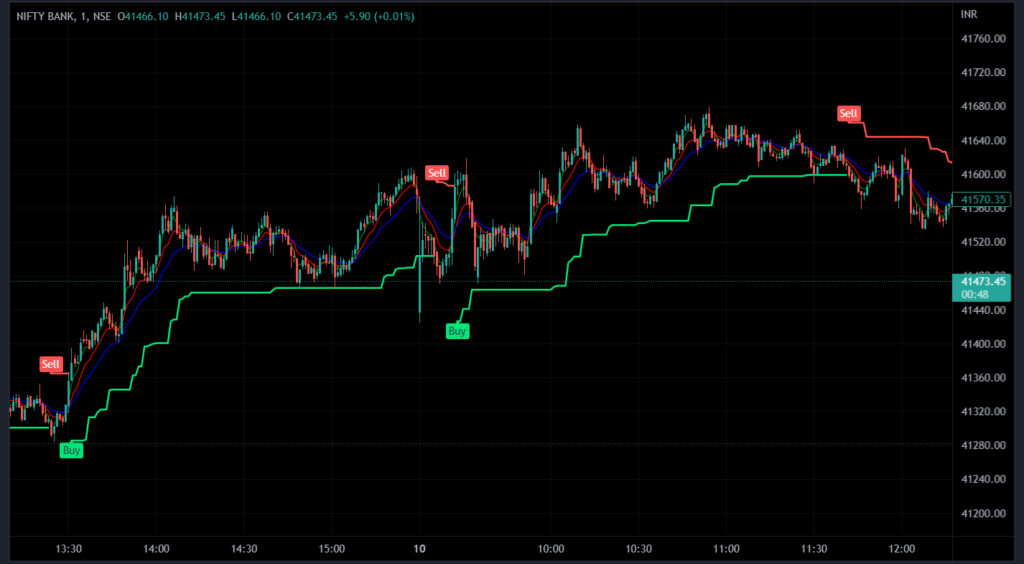
As you can see above the green and red line with BUY and SELL signal getting generated, it is Pivot point supertrend.
What is the use?
It can be used to see or observe any changes in the trend on basis of pivot point as well as overall strength. You must have heard about supertrend but this indicator also has properties of pivot points as well as supertrend, that makes it amazing.
What does it Indicate?
As we generally already know that supertrend indicates the change in trends on basis of volume and averages and etc calculations, but this indicator indicates change in trend on basis of pivot points as well.
Summary
This indicator is stronger and more reliable than just supertrend, you can use it for trading on trend change or also use it as a confirmation provider for taking any fresh entries or exits.
4: RSI Candles (by glaz)
Search “RSI candles” and from results select the one which is by ‘glaz’. It should look like above, few candles will be colorful, two colors are in use, one while in downtrend and one while in uptrend.
What is the use?
It’s use is to predict any coming small to big changes in the trend as you can see in the photo above whenever a colored candle formed there was a small change in trend.
What does it indicate?
Almost every trader knows about an indicator called RSI, this indicator is based on RSI but its in candles format, whenever market is in downtrend but relative stregth is opposite it forms a pinkish color indicating that relative stregth is not stong enough for downtrend, similarly it makes greenish candle during uptrend.
Summary
Whenever while trading if you see such colorful kind of candle, you shall use it either for taking fresh entry/exit or use this as a confirmation for entry/exit.
5: Liquidity Swings (by lux algo)
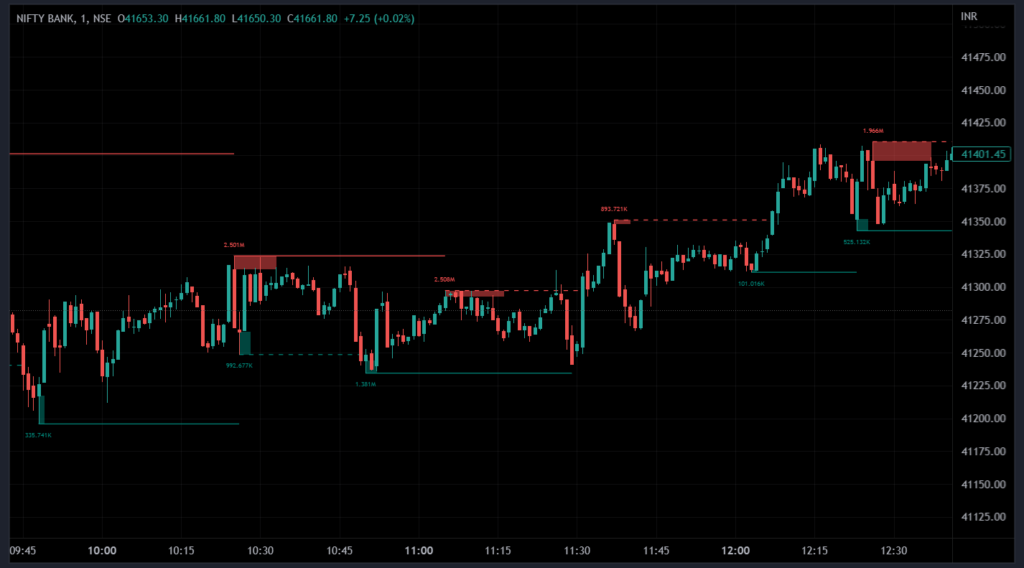
Search “Liquidity Swings” in indicators and select the one which is by “lux algo”. There will be some zones in the chart as you can see in above photo
What is the use?
The Liquidity Swings indicator can be used to highlight significant swing areas which can be used as accumulation and distribution zones on lower timeframes that might play a role as future support or resistance.
What does it indicate?
For traders to locate accumulation/distribution zones and levels to trade as support and resistance, the Liquidity Swings indicator highlights swing areas with significant trading activity. A zone that separates the swing areas indicates the number of times price revisited them. Labels on the chart also highlight the accumulated volume within swing areas.
Summary
The indicator can only display significant swing areas with a higher degree of liquidity by filtering them by volume. These swing areas may have been visited by the price more frequently or may be wider, indicating higher volatility.
These were the amazing, 5 tradingview indicators you should check.
We have already uploaded a scalping strategy using one of the above indicators you can check here


Pingback: How to open Demat account in Sharekhan - Bazaar Badshah
Pingback: 3 Best indicators for option trading in India - Bazaar Badshah